Digital marketing experts insist that infographics simplify complex data, eliminate any chances of misinterpretation and make information easily understandable. Infographics simplify data, preventing users from conducting deep analysis by including only basic facts. Not surprisingly, infographics are a viral, catchy kind of content that the average user easily understands and shares often.
Sure you can create an infographic and wait for hundreds of tweets and for your backlinks to increase…. Someday it might even become a reality, but let’s be realistic. If your blog or website doesn’t have the same level of engagement and traffic as listed below, then you have to take action to succeed.
Popular Infographics of 2014
| Infographic Name | Tweets | Backlinks |
|---|---|---|
| What SEO Used to be Versus What SEO is Now | 244k | 27 |
| Marketing Technology Landscape Supergraphic (2014) | 1.6k | 1.3k |
| On-page SEO | 730 | 631 |
Infographics provide a cheap, effective alternative to written content and slideshows. Their popularity stems from the laziness and busyness of the average user, who scans visual data rather than reading articles thoroughly. To boost traffic to your website, promote your infographic by targeting interested users on Twitter and expanding the number of backlinks on relevant websites.
Boosting Twitter Engagement
Expanding the reach of your infographic on Twitter starts from the ground up. Finding new followers as well as creating and sustaining relationships with them builds a strong network for your future infographic.
You can collect new followers directly in Twitter, which allows you to search for people who have just shared an infographic. However, if you want to speed up this process significantly, I highly recommend using tools like SocialOomph or Twilert. Both tools send you emails with tweets according to the specific keyword filters you set. The real benefit of using such tools is the ability to capture past tweets, which you can’t do in Twitter search. So you don’t need to search every hour in Twitter for new tweets – plus you can review emails in your mailbox at the most convenient time for you.
Because Twitter no longer gives users the ability to send direct messages to users who aren’t following your account, this means you need to find other ways to convert those contacts into followers. You need to start following your targeted contacts. The best way to capture these selected Twitter users’ attention is to start actively retweeting and sharing their posts.
If you have enough free time, you should consider Twitter chats. Taking part in Twitter chat is another great way to grow your Twitter audience. It gives you a chance to easily capture users who are interested in the topics represented in your infographics and highly active on Twitter. To find such chats, you only need to perform a Google search.
Growing your Backlinks Profile
To identify influential, relevant websites, go beyond a Google search and analyze backlink profiles of popular infographics in your niche.
The easiest way of performing backlink analysis for any URL is to use special tools like Ahrefs.com, Majesticseo.com, SEMrush.com, etc. The tools listed below will give you access to backlinks reports, which you can export with only one click.
The screenshot shows the Ahrefs Backlinks Report

After you’ve exported the Backlinks report, you’ll need to use Excel. Typically with exported data you won’t be able to see a column with domain names. I believe that without such a column, you can’t quickly filter out the spammy sources from your exported report. Normally, creating a column with domain names doesn’t take more than a few minutes.You only need to copy and paste all referring page URLs into a new column, then click on the Data tab and find the “Text to Columns” operation. Using the Convert Text to Columns Wizard, select “Other” in the Delimiters section and type in the value “/”.

When I know the domains, it becomes very easy to filter out spammy resources that have tons of backlinks referring to the same infographic and that are irrelevant. Generally this can be done by sorting the number of URLs for each domain from the highest number to the lowest number. The ones with the highest numbers must be removed from your list.

Finally I came up with the following table, where I divided backlinks according to Domain Rank Tiers. The websites with ranks from 61-100 are the most powerful ones. Such an approach breaks down the list by “likely to reach” and “less likely to reach.”
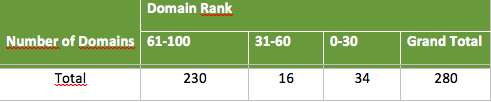
So build up a final list of influencers that you’re going to reach out to and ask/beg for backlinks.
If you’ve already followed all of the above steps, then you’re now ready to rock!
Once your infographic is published on your blog, you can submit your visual content to a couple of infographic sites as well:
I collected all the new and well-known infographic websites and sorted them by Alexa Rank (the higher the rank, the better the domain), which shows the general strength of a domain in Google. If you know of any other sources where you can submit your infographics, I would greatly appreciate it if you’d share them in the Comments. I try to keep my list updated, but I still sometimes overlook some really great infographic portals. Certainly none of these websites (besides the paid ones) will give you a 100 percent guarantee that your infographic will be published. Still, I believe that if your content was created by a good designer and it contains some interesting data, it will be approved and published for sure.
My blog is really tiny right now in terms of backlinks, I’d love to try to use this scheme and see how it works for an unknown site. Hopefully at the end of February, I’ll be ready to share some facts and stats. I’m really excited about it!